
As Hurricane Sandy was ravaging the eastern seaboard, the whole graphics team got together to brainstorm on visualizing the damage.
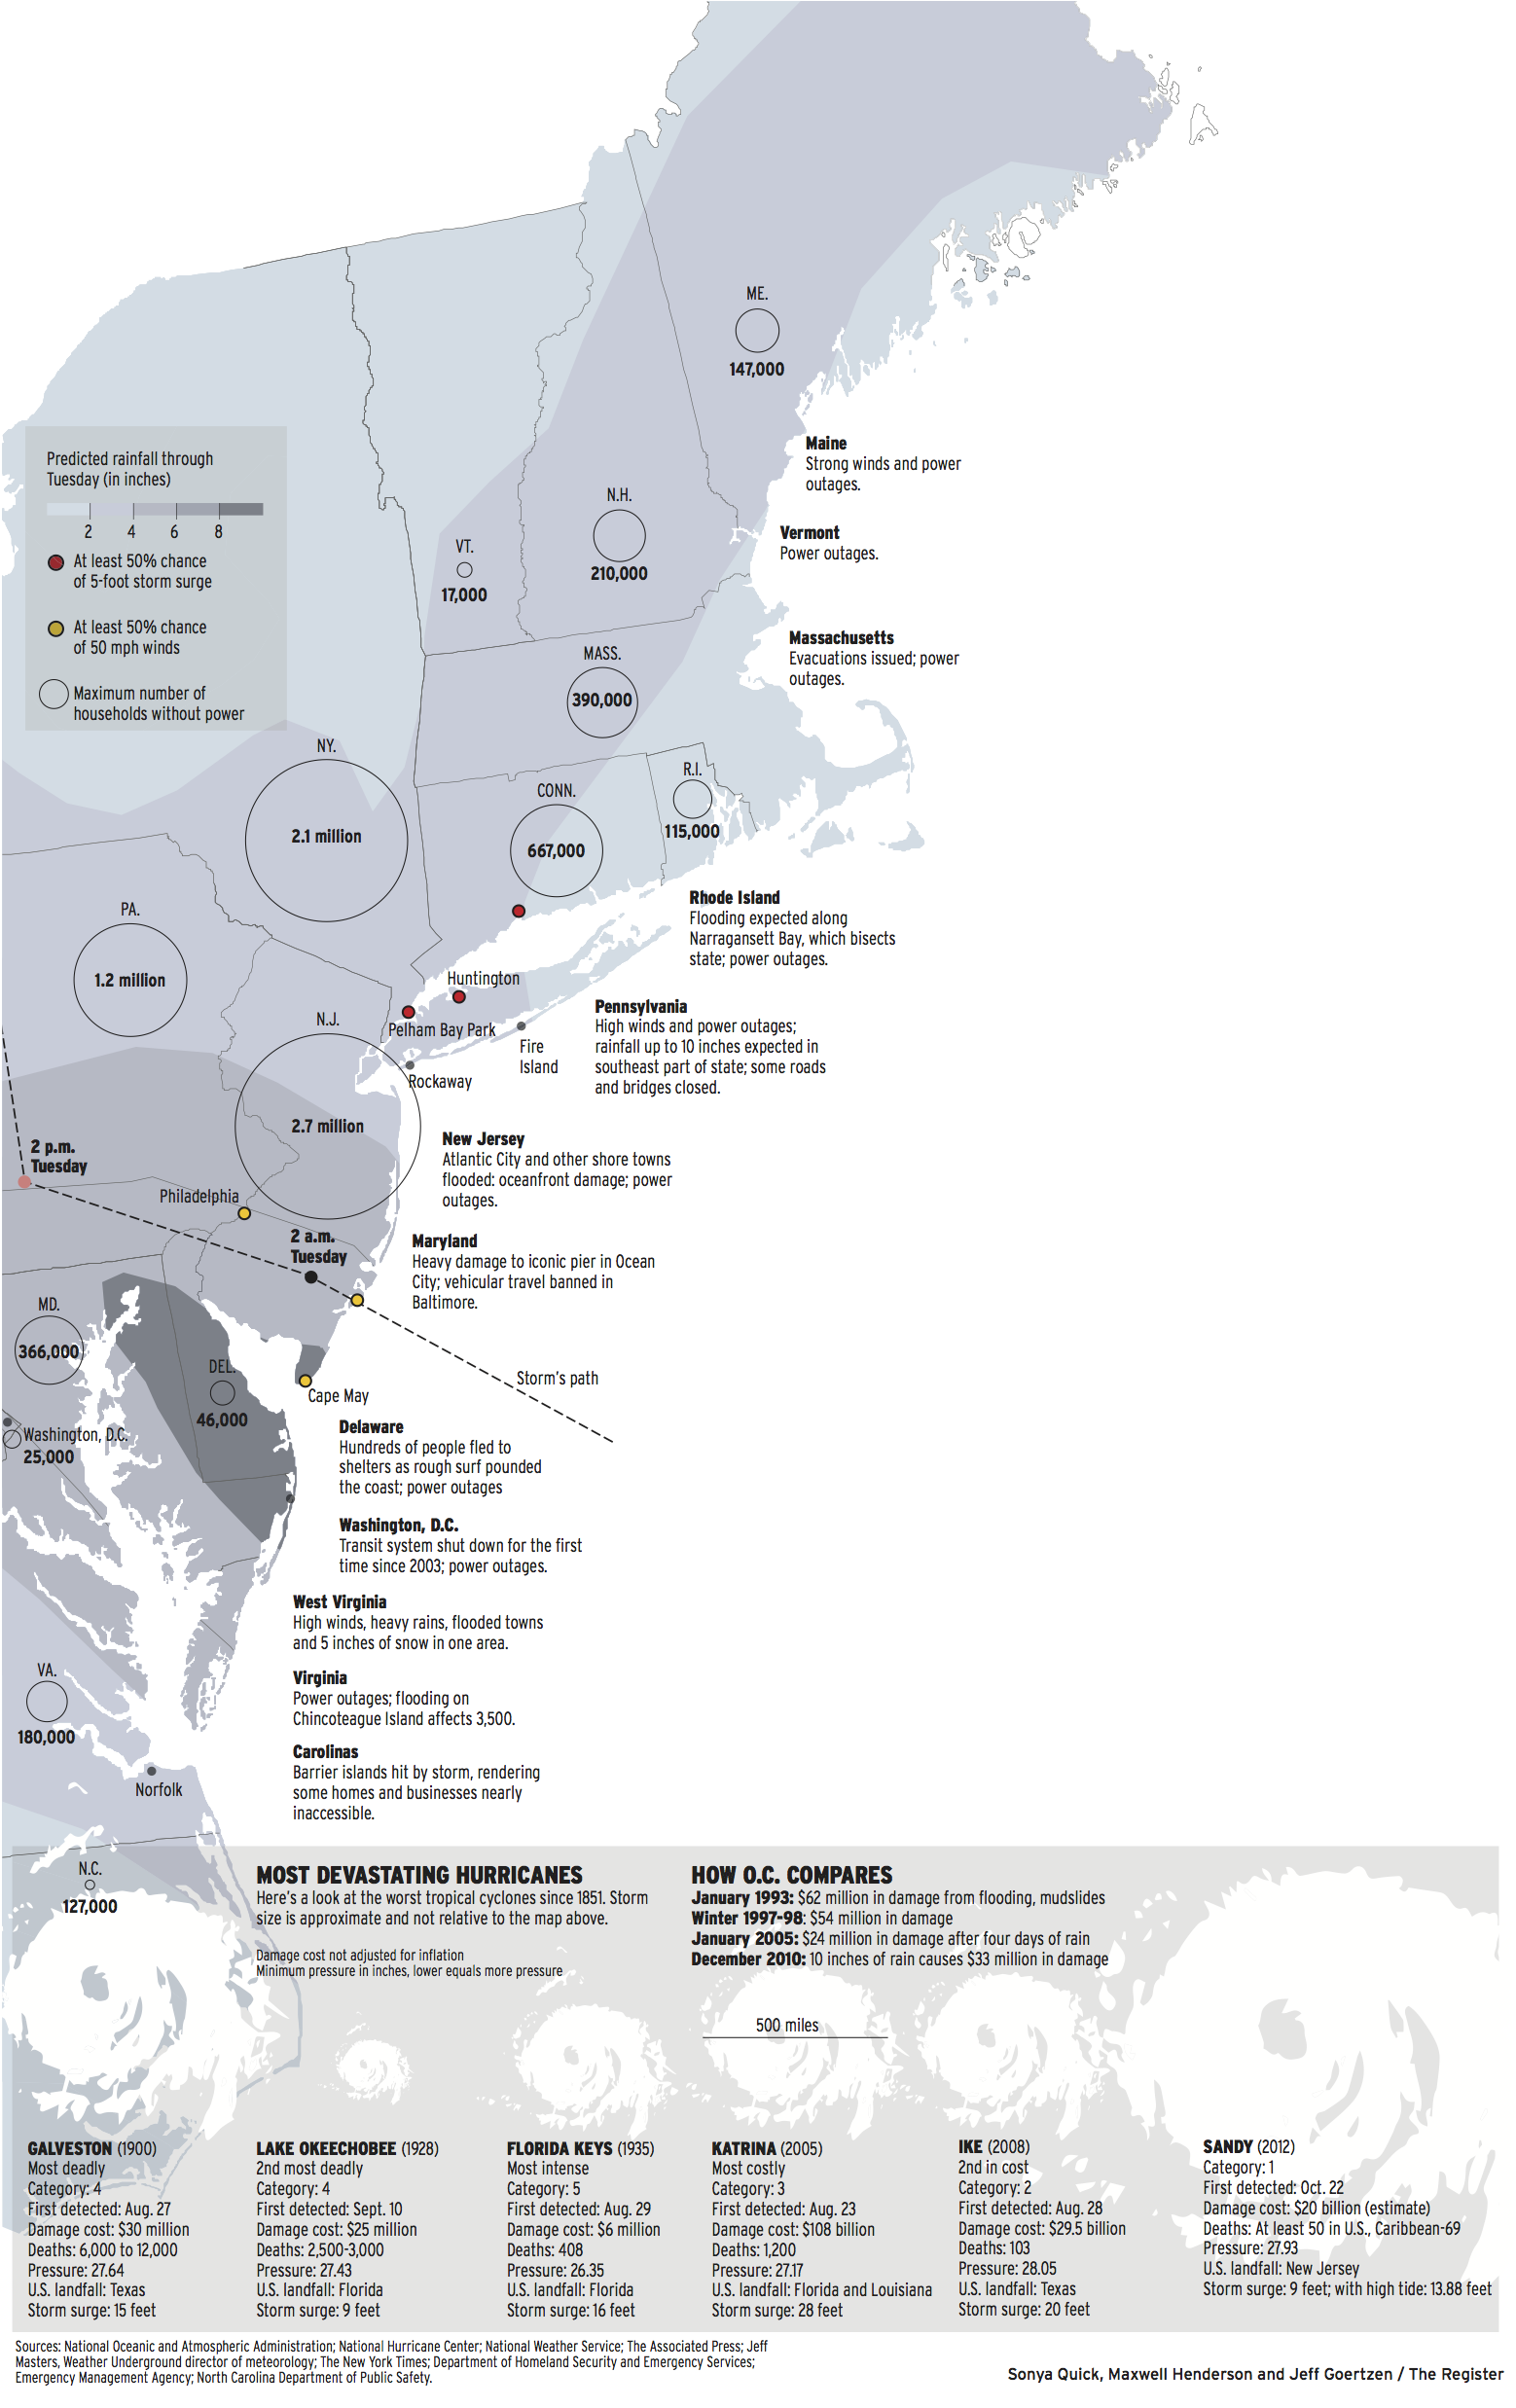
We decided on showing: projected weather (to move the graphic forward), areas without power (illustrate damage), text notes (giving more detail on each state).
I also worked on finding information on how Sandy compared to past hurricanes. There is no single way of comparing hurricanes, so I worked to find storms that are top in one category (most intense, most deadly and so on).